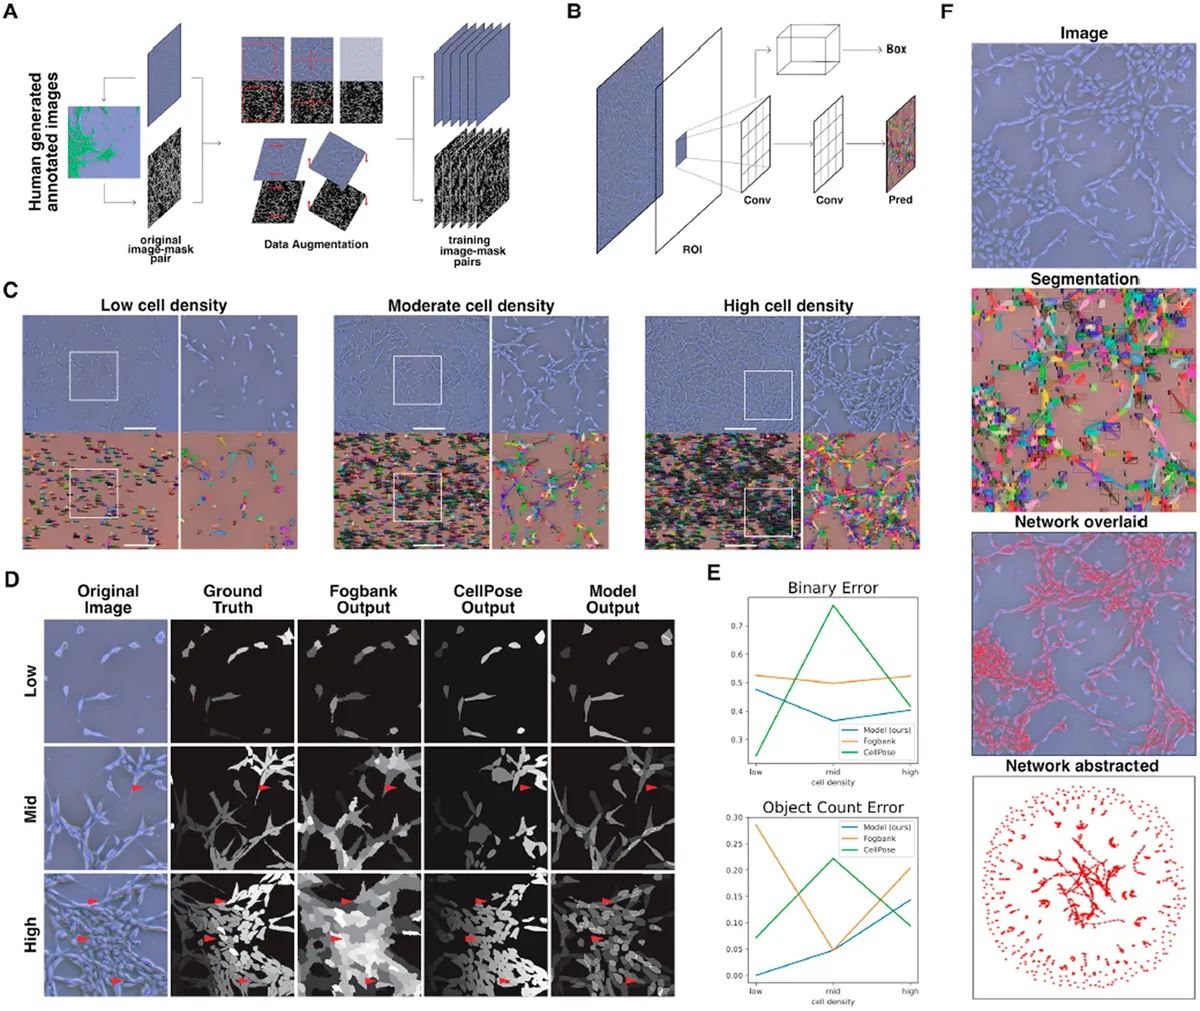
Fig. 1. Instance segmentation of phase contrast images was performed using a convolutional neural net. (A) Training data were prepared in two steps: first, segments of phase contrast images were annotated manually, producing an original mask from an original image. Second, a series of random augmentations—rotation, shear, contrast, reflection and crop—were applied to each original image-mask pair to generate multiple augmented images-mask pairs from each original. The model was trained on the resulting augmented dataset. (B) The Mask RCNN architecture was trained and used to perform instance segmentation. This modular architecture uses a classifier to detect individual objects in an image and produces a binary mask for each. (C) Representative ground truth images and segmentation visuals for a range of cell densities. Individual cells are marked in the segmentation visuals with a unique color bounding box and mask overlay, as well as a classification confidence score (0.00–1.00). Scale bar is 500 microns. (D) We compared our model outputs against commonly used unsupervised and supervised segmentation methods Fogbank and CellPose. At mid- and high-cell density, the learned model demonstrated much higher accuracy at separating closely adjacent cells. Scale bar is 100 microns. (E) Our model shows consistently high performance across the full range of cell confluencies compared to both Fogbank and CellPose. (F) Image segmentations are used to obtain single-cell morphology and cell network topologies.
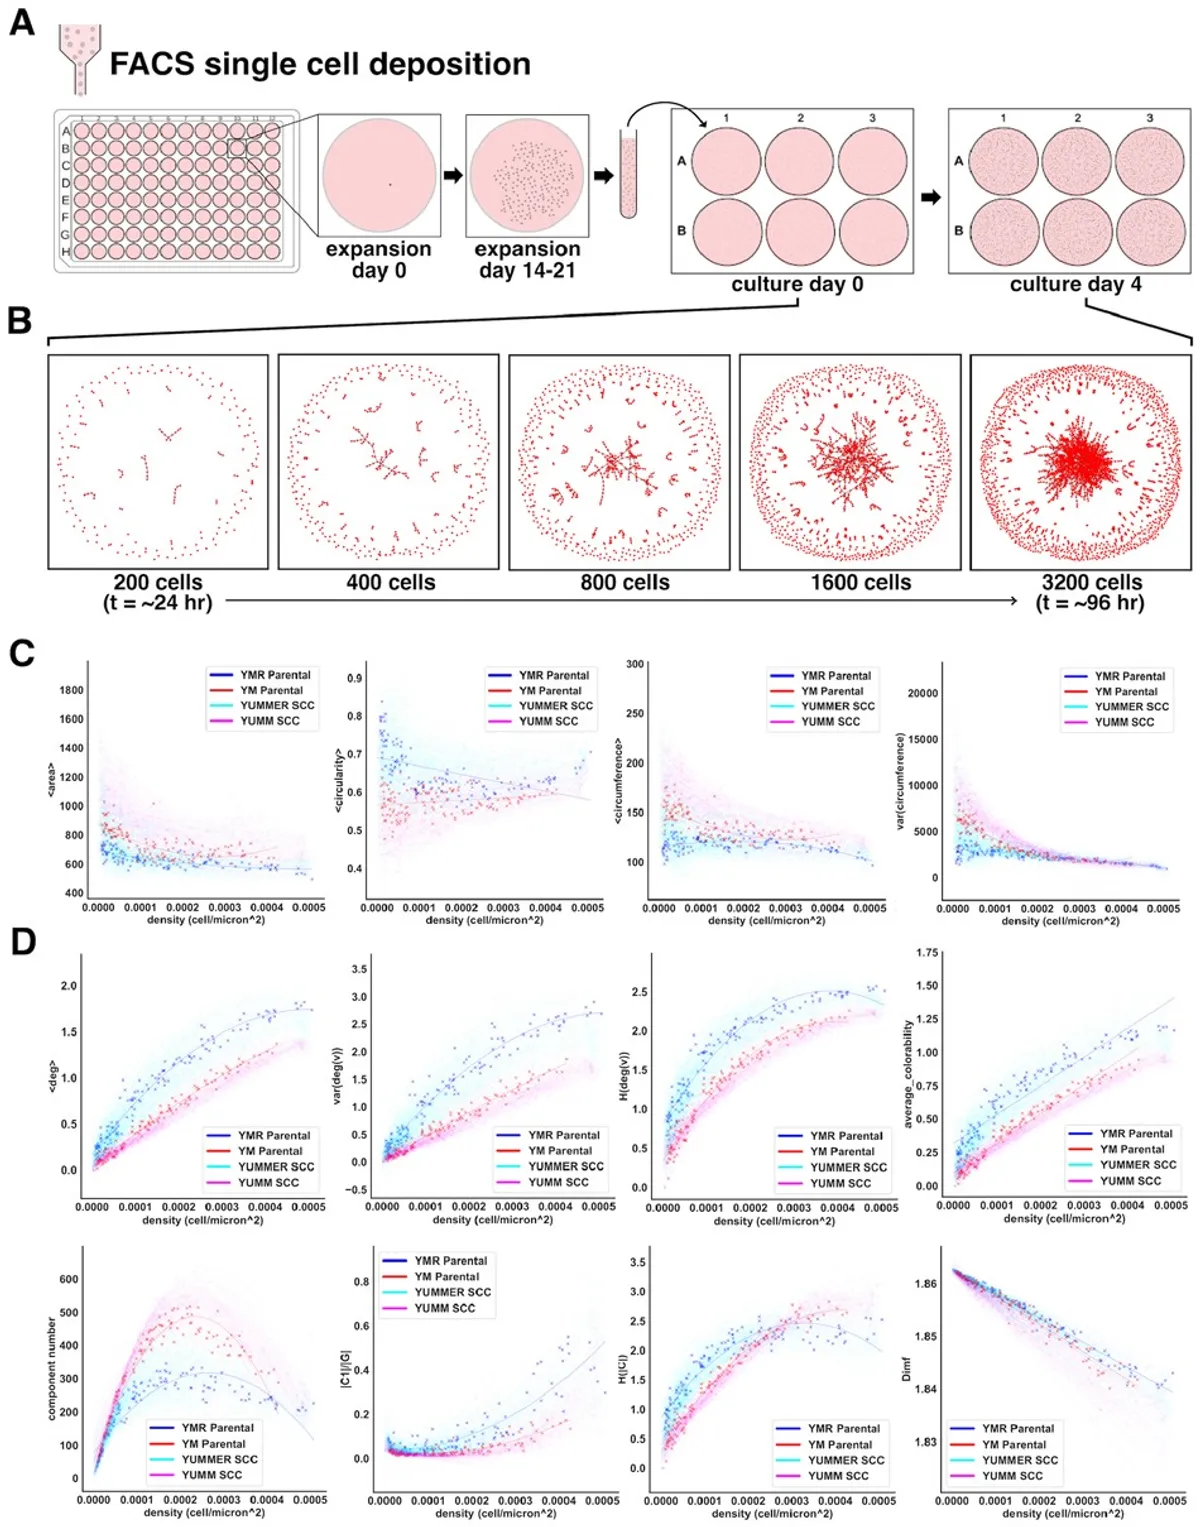
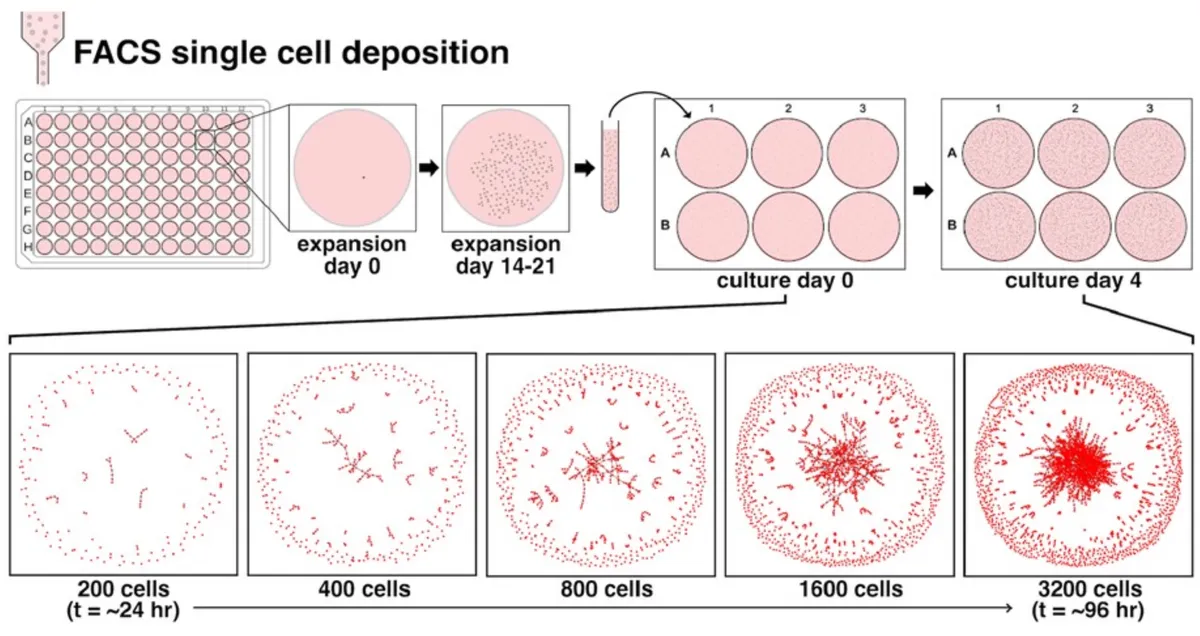
Fig. 2. One hundred thirty-six SCC lineages are characterized by single-cell morphology and cell network morphology over time. (A) Single-cell clone lines are obtained through FACS deposition of one cell into each well of a 96-well plate. Following an initial expansion period of 14–21 days, cell clones are trypsinized, suspended, and re-seeded at low density into wells of a 6-well plate. Cells expand and are imaged over the following 96 h. (B) Generated cell networks represent a typical growth pattern of a clone line over the second expansion period. (C and D) Cell shape properties (C) and network topology-derived properties (D) describe complex patterns of growth when plotted against cell density. Each point corresponds to a single image and contains data corresponding to the derived cell network and hundreds to thousands of cells. The collection of all data points from one clone over the course of a 4-day expansion period constitutes a unique morphological progression. Polynomial regression is used to fit curves to each clone morphological progression.
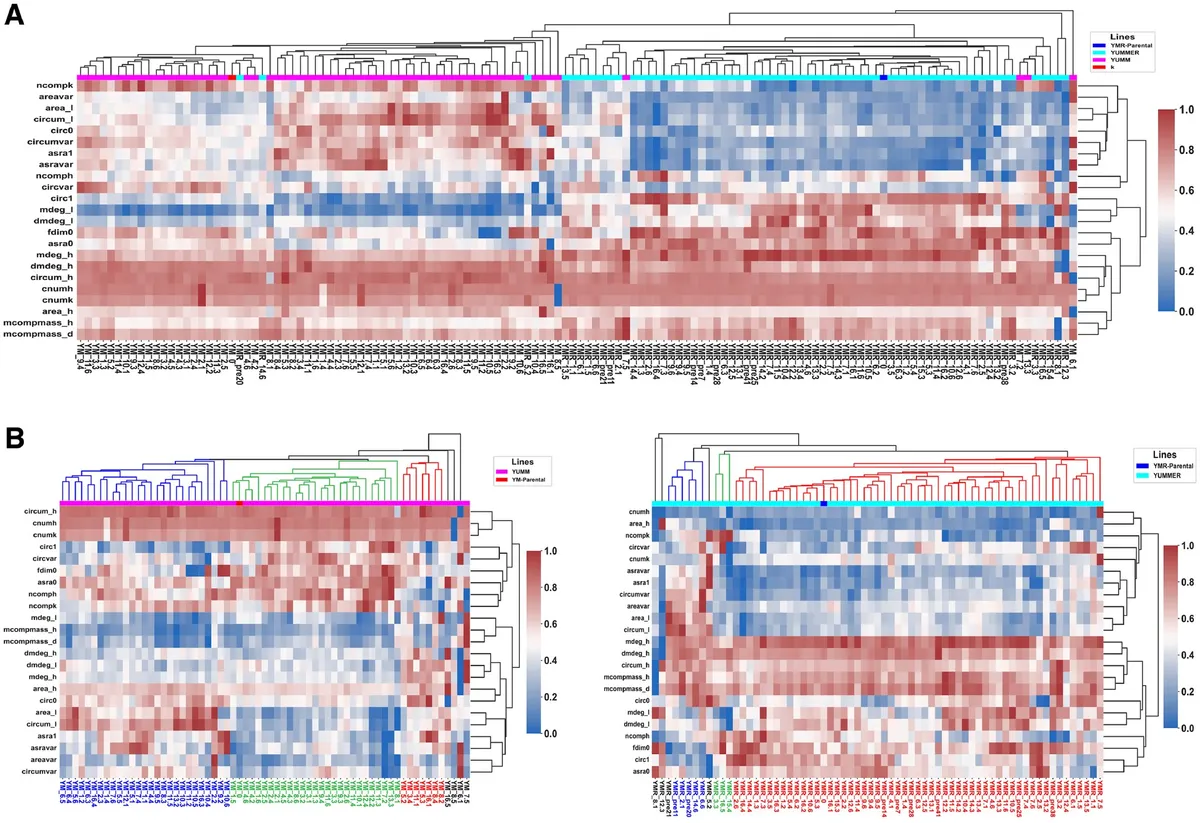
Fig. 3. Clustering of SCC lineages distinguishes between YM and YMR clones and identifies six morphological subclasses of interest. (A) Hierarchical clustering of the 136 clone lineages robustly distinguishes between YM-derived and YMR-derived clones. (B) Dividing the clones into their respective cell lines, further hierarchical clustering identifies six morphological subclasses, three within YM and three within YMR.
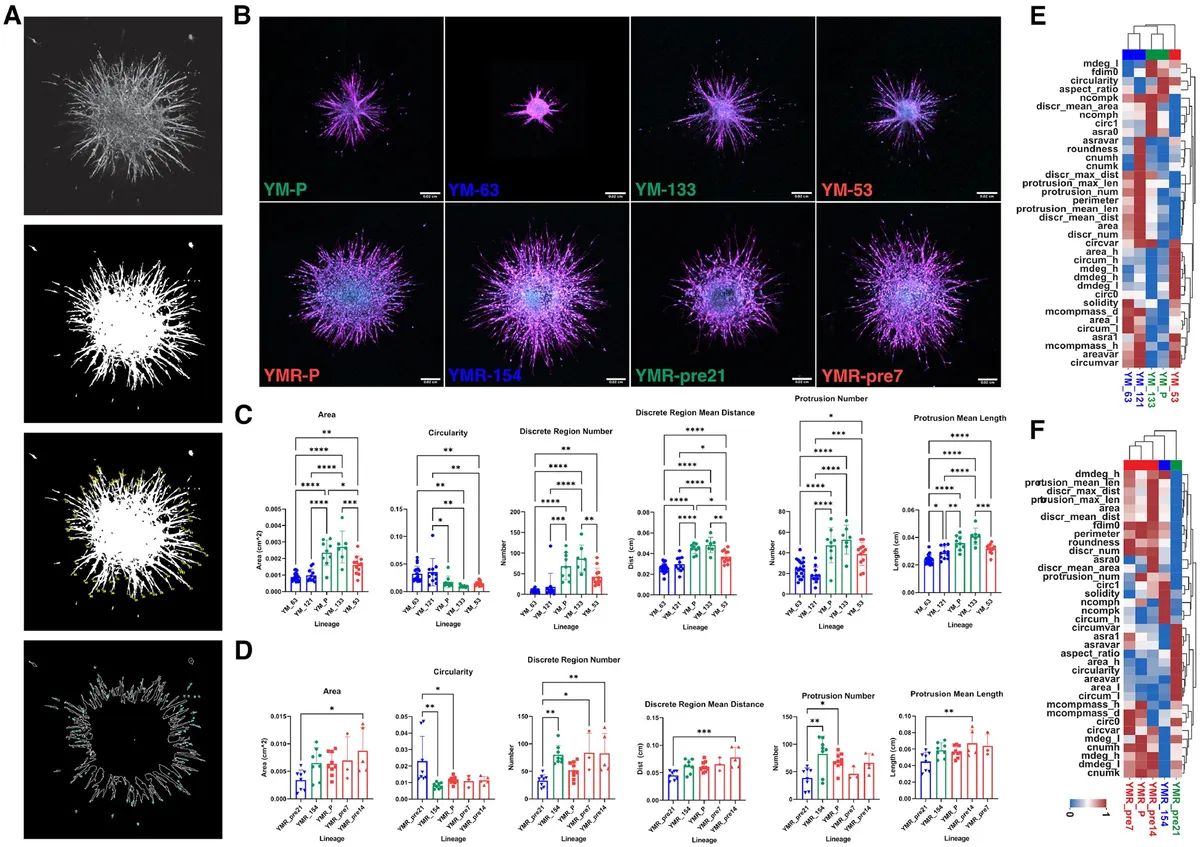
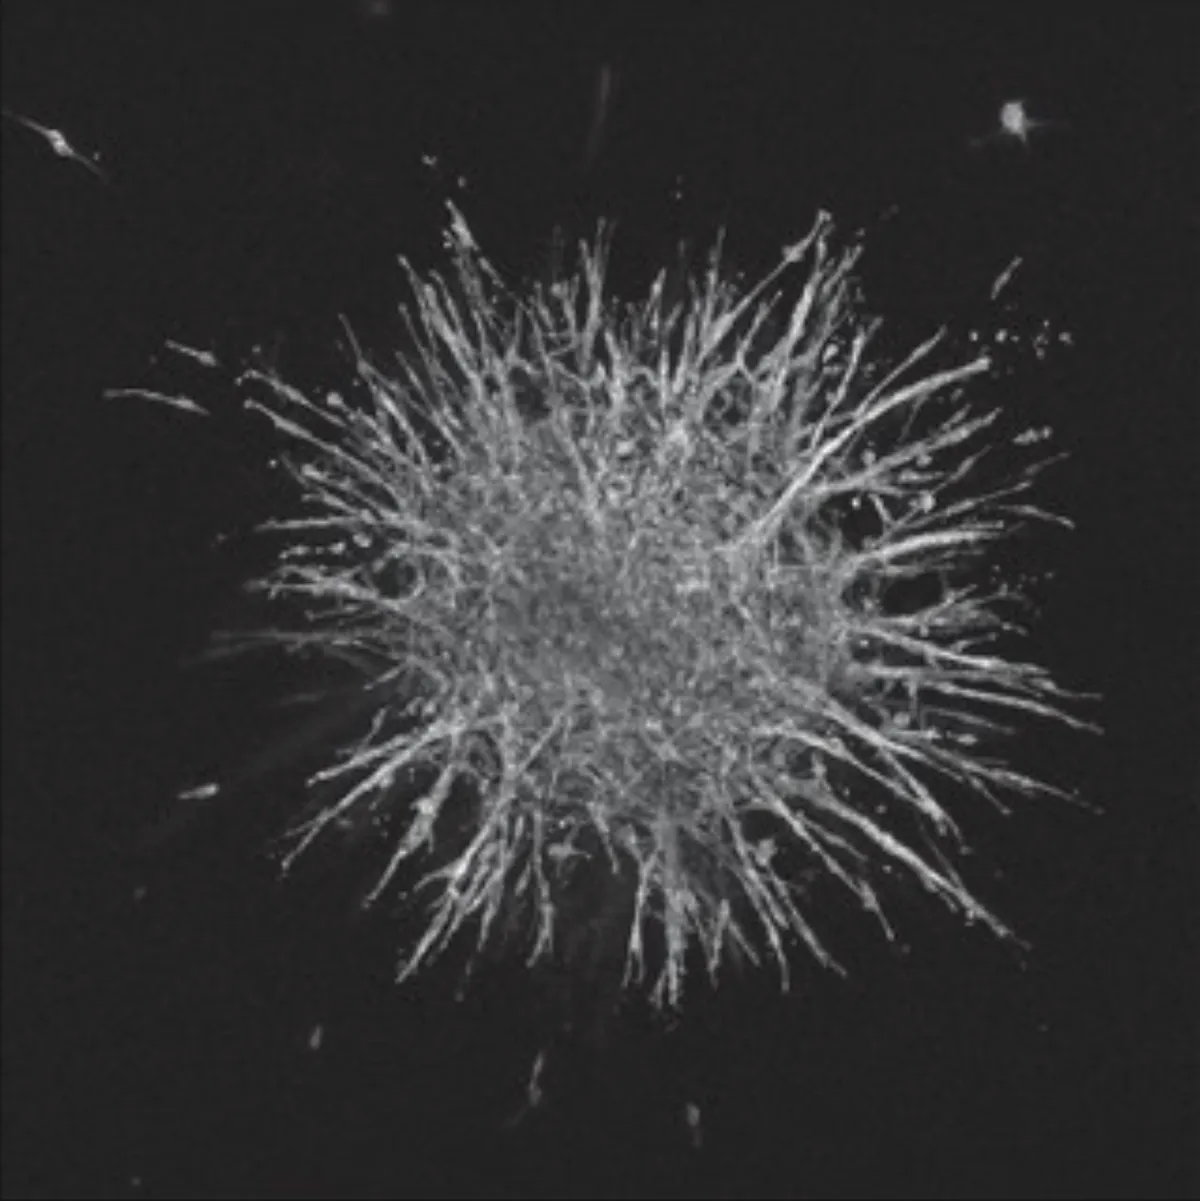
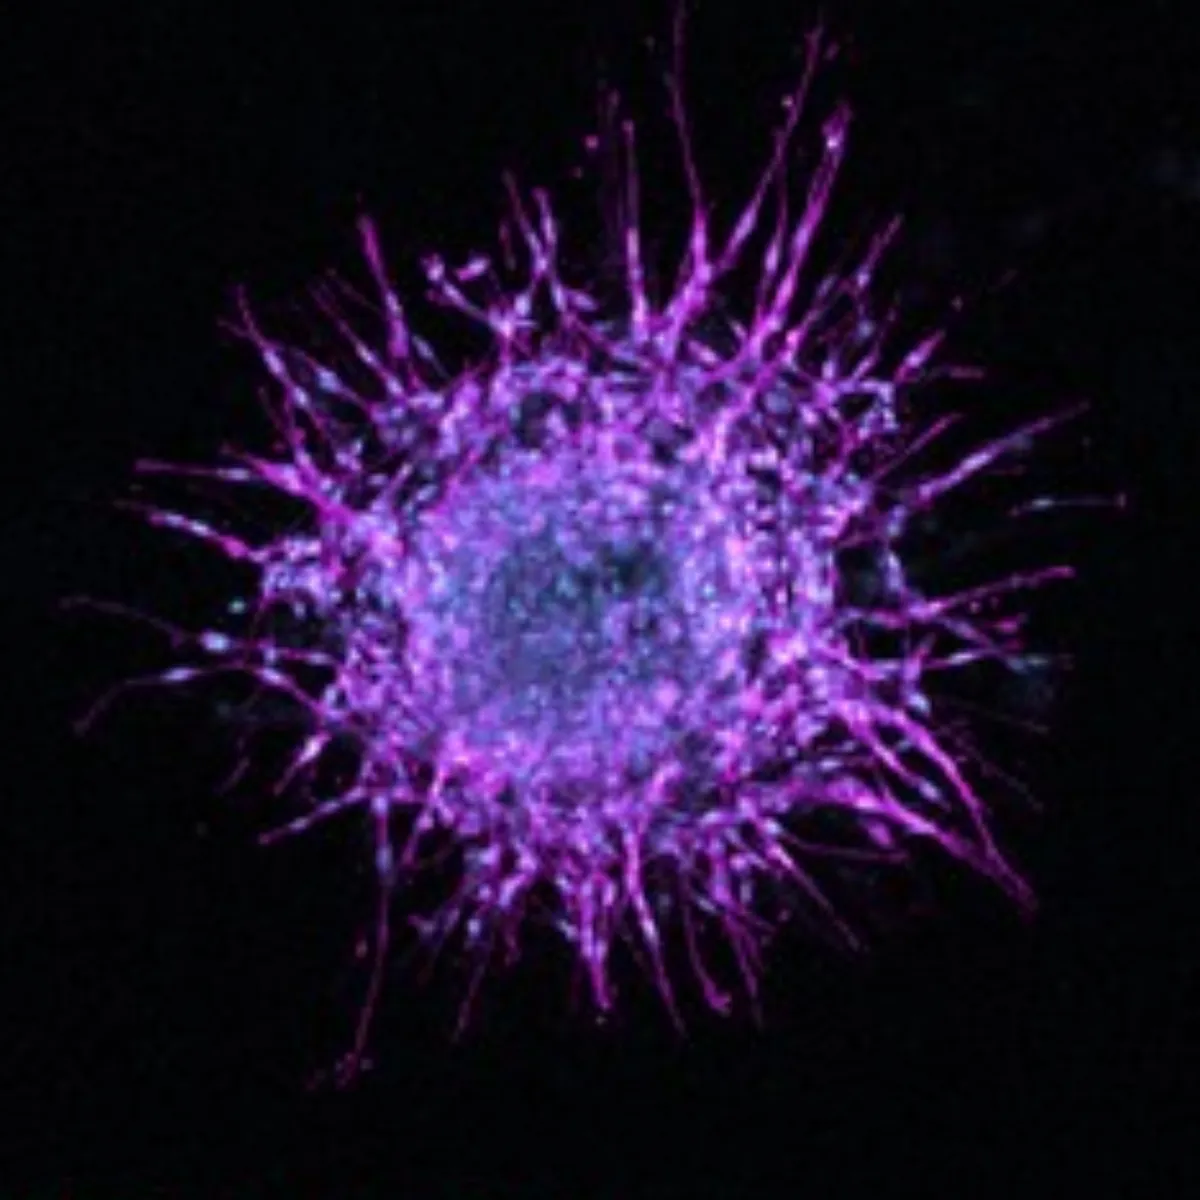
Fig. 4. 2D-derived morphological subclass predicts 3D spheroid invasiveness. (A) Spheroid shape and invasiveness are measured from projected, binarized, z-stacks. (B) Representative images of spheroids generated from parental and clonal lineages embedded in a 3D collagen gel show vast differences in cell migratory phenotype. F-actin (magenta, peripheral) and DNA (cyan, central) are labeled. Scale bar is 200 microns. (C and D) We compare the 3D shape and invasive behavior of subclass representative clones. Significant differences between spheroid shape (area, circularity) and invasion (protrusion and disseminated cell dynamics) exist between populations across subclasses. (*, **, ***, **** correspond to P < 0.05, 0.01, 0.001, 0.0001, respectively). (E and F) Repeating the hierarchical clustering from earlier now including 3D spheroid parameters alongside 2D cell shape and network topology parameters reiterates the clustering obtained from only 2D parameters.