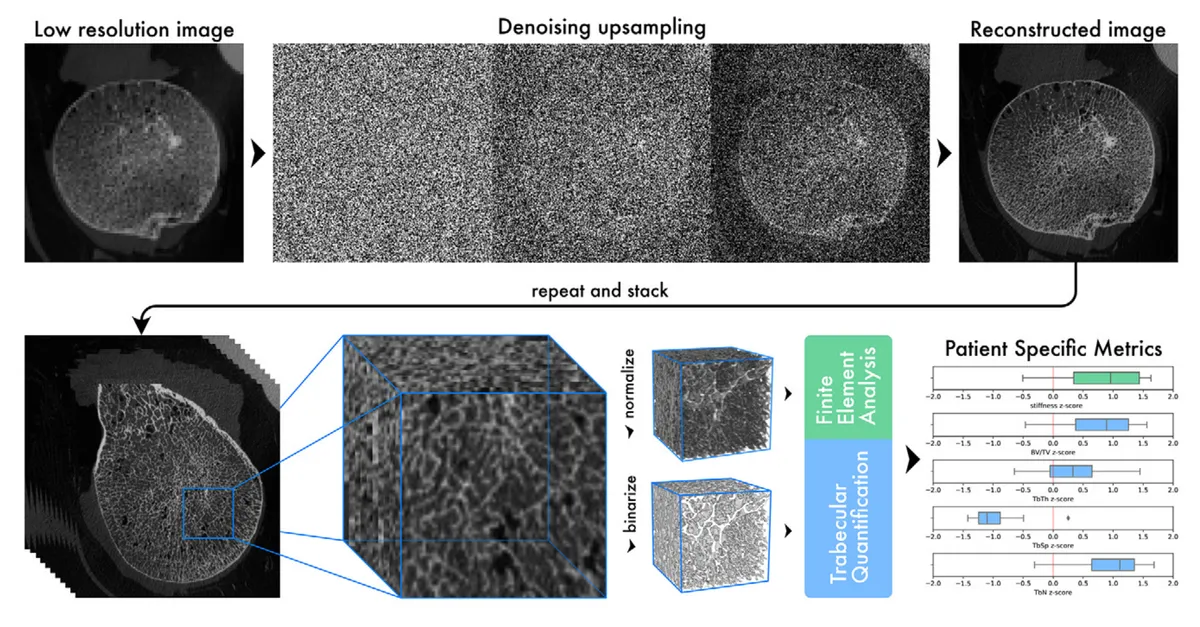
Method overview. Low-resolution sections from CT scans are upsampled and stacked to construct a detailed three-dimensional image. From this image, microstructural and mechanical characteristics of the trabecular bone are calculated, which can be used to describe a patient's bone health status. BV/TV = trabecular bone volume fraction, TbN = trabecular number, TbSp = trabecular separation, TbTh = trabecular thickness.
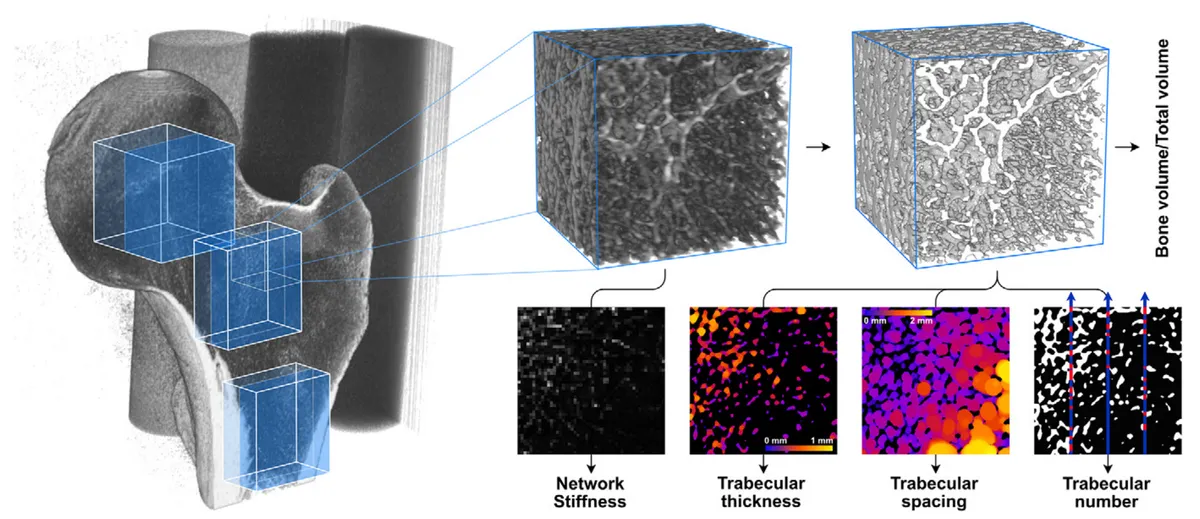
Sixteen regions of interest (eight femoral head, four neck, four upper shaft) were selected from each scan. The ImageJ library BoneJ was used to quantify four trabecular parameters, and a finite element solver was used to calculate trabecular network stiffness. Bone parameter maps at the bottom of the figure represent the following (from left to right): the strain energy of an axial section across the region, a trabecular thickness heatmap, a trabecular spacing heatmap, and an illustration of trabecular number.
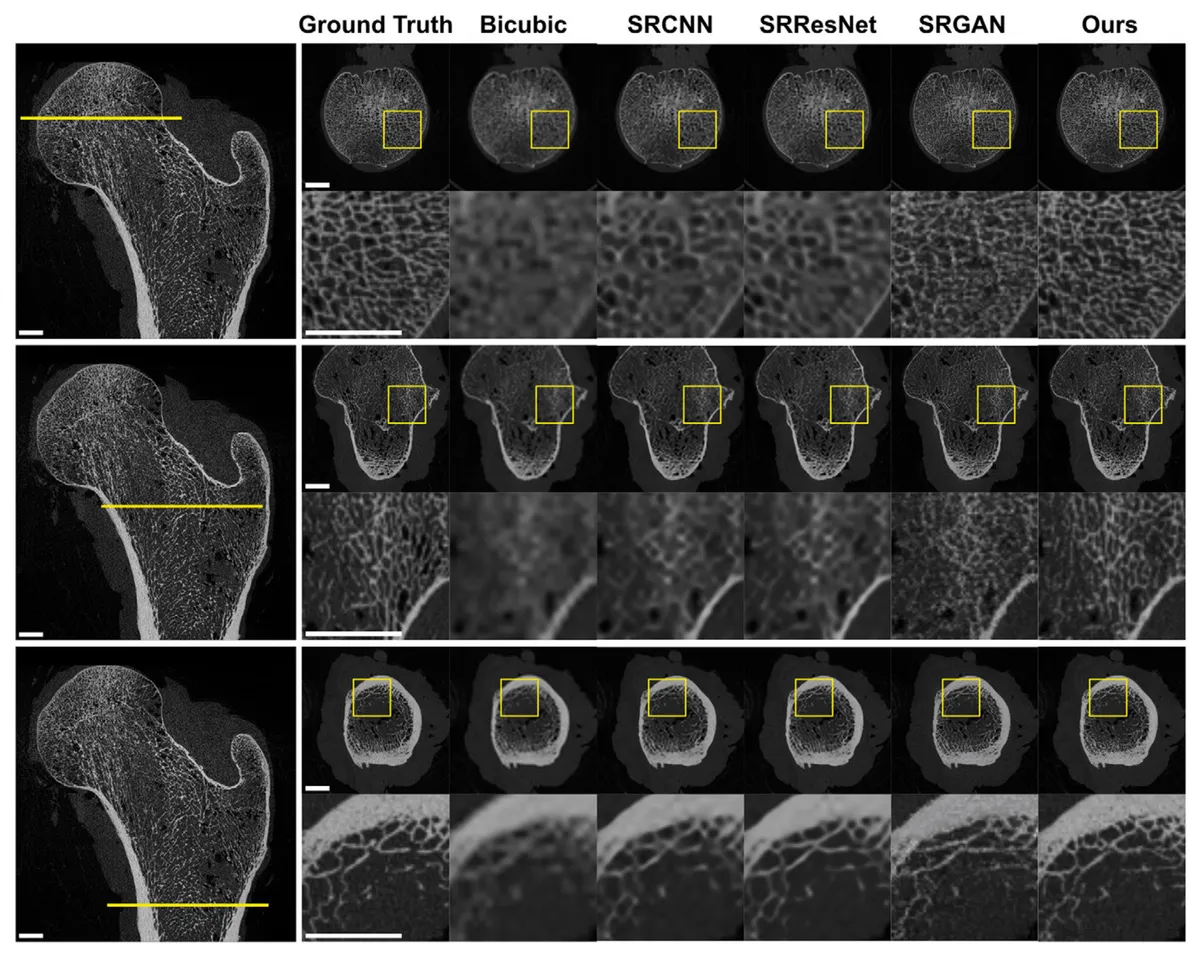
A qualitative comparison of several deep learning upsampling methods. Ground truth images and representative reconstructions are shown for the femoral head (upper row), greater trochanter (middle row), and upper shaft (bottom row). Enlarged views depicting detailed trabecular bone illustrate the texture-smoothing behavior of convolutional neural network–based models and the advantages of our method in preserving image sharpness and network connectivity. Scale bar is 1 cm. SRCNN = super-resolution convolutional neural network, SRGAN = super-resolution generative adversarial network, SRResNet = super-resolution ResNet.
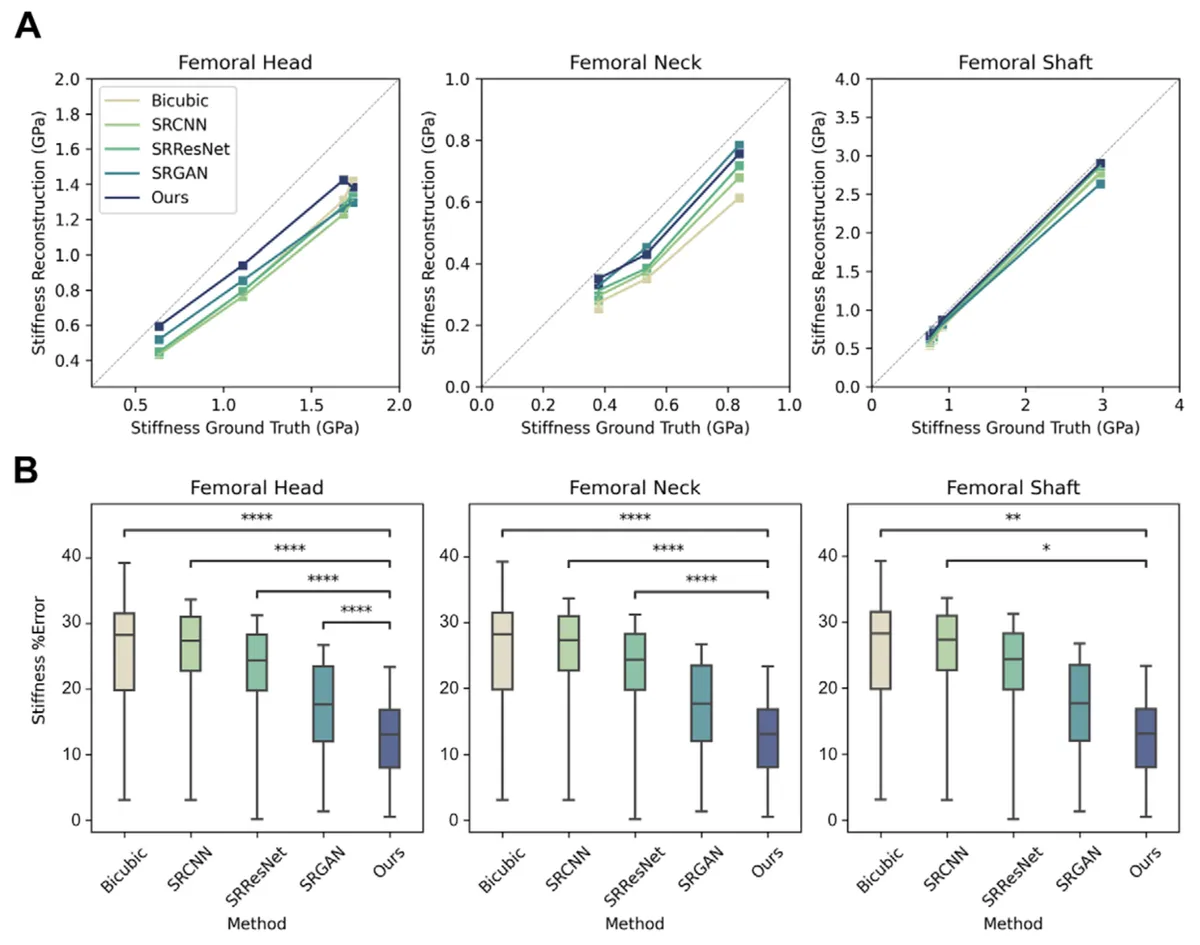
Mechanical stiffness, calculated by finite element analysis, was compared across five reconstruction methods. There were 32 regions of interest analyzed in femoral heads, 16 in femoral necks, and 16 in femoral shafts. (A) Reconstruction is plotted against ground truth, with the gray line denoting perfect agreement. (B) The corresponding percentage errors are plotted with statistical significance determined by a Friedman test and post hoc Dunnett test, with Bonferroni correction for multiple comparisons. Top and bottom edges of boxes indicate dataset quartiles, horizontal lines the means of the datasets, and whiskers the full range. * = P ≤ .05, ** = P ≤ .01, **** = P ≤ .0001. BV/TV = bone volume over total volume, SRCNN = super-resolution convolutional neural network, SRGAN = super-resolution generative adversarial network, SRResNet = super-resolution ResNet, TbN = trabecular number, TbSp = trabecular spacing, TbTh = trabecular thickness.